
Gaussian world
The probabilistic approach to machine learning, described in “Probabilistic Approaches to Machine Learning,” uses various probability distributions starting from the Gaussian distribution.
The Gaussian distribution (normal distribution) is named after Carl Friedrich Gauss, but in fact it is said that Gauss was not the “first to discover” it, as follows.
| Year | name | Contribution |
|---|---|---|
| 1733 | Abraham de Moivre | First found the approximate form of the normal distribution (as the limit of the binomial distribution) |
| 1809 | Carl F. Gauss | Explicit use and introduction of the normal distribution as an error model for astronomical observations |
| 1810 | Pierre-Simon Laplace | Mathematical development of the initial form of the central limit theorem (error approaches normal distribution) |
As shown in the table above, Gauss mathematically analyzed the errors in the observation data and showed that the normal distribution is natural, and in his 1809 book “Theoria motus corporum coelestium” he combined the maximum likelihood method (a method of estimating the most probable value) with the normal distribution and applied it to the determination of the orbits of celestial bodies, In his 1809 book “Theoria motus corporum coelestium”, he combined the maximum likelihood method (a method for estimating the most likely value) and the normal distribution and applied it to the determination of the orbits of celestial bodies, which is said to have come to be called the “Gaussian distribution.
The Gaussian distribution is expressed by the following equation.
\[f(x)=\frac{1}{\sqrt{2\pi\sigma^2}}exp\left(-\frac{(x-\mu)^2}{2\sigma^2}\right)\]
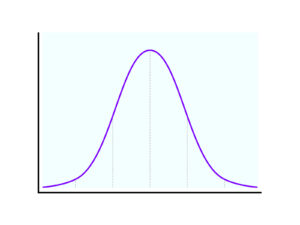
A graphical representation of this would look like the following

It is mountain-shaped with the mean at its center and decreases exponentially and rapidly with distance from the center.
For this Gaussian distribution, Laplace used the Central Limit Theorem, as shown in the table above, to prove that when many small random elements (errors and fluctuations) are combined, the result approaches a normal distribution.
For example, when many people toss a coin 10 times and the number of times the coin comes up in the air varies from person to person, a graph of the distribution of the number of times the coin comes up in the air shows a bell-shaped distribution with a mountain in the middle (= Gaussian distribution). The following are other phenomena that can be seen in various phenomena in the natural world.
| phenomenon | Reasons for Gaussian distribution |
|---|---|
| People’s Height | A multitude of factors accumulate, including genetics, nutrition, environment, and growth hormones. |
| measurement error | Synthesis of errors such as accuracy of measuring instruments, temperature, operator’s camera shake, etc. |
| Noise (sound, radio waves) | Due to the synthesis of many tiny random signals |
| Observations of celestial bodies | Atmospheric fluctuations and observation errors are synthesized |
The meaning of this law is that even if individual factors are random and disparate, when many of them are gathered together, they follow an “average” and form an orderly whole (bell-shaped).
This can be said to bridge the gap between probability theory and determinism, where individual events are random (probabilistic) but the overall behavior appears deterministic (deterministic). This represents the wonder of nature, where “microscopic randomness gives rise to macroscopic regularity.
This is in contrast to Eistein’s famous statement, “God does not play dice with the universe. God does not play dice with the universe.
This Gaussian distribution appears not only in natural phenomena, but also in the world of information science, where it can be applied to a principle called the “maximum entropy principle. This can be paraphrased as “when we assume things without prejudice (the state of knowing the least), we get a Gaussian distribution” because the distribution with the least amount of information (representing the most ignorance) is the Gaussian distribution when only the mean and variance are determined.
Taking advantage of this characteristic of Gaussian distribution as the fundamental structure of uncertainty in information, energy, and observation, the following applications have been considered in AI and machine learning.
- Gaussian Processes → Viewing Uncertainty as a Function
- Bayesian inference → Gaussian distribution is a “convenient and natural” distribution that converges beautifully in computation
- In generative models (e.g., VAE), smooth generation is possible by placing the latent space in a Gaussian distribution.
non-Gaussian world
In order for the Gaussian distribution to be valid, mathematical conditions such as “independence from each other” and “finite variance” are indispensable.
The mathematical condition of “being independent of each other” is expressed as follows
\[P(X=x\ and\ Y=y)=P(X=x)\cdot P(Y=y)\]
It indicates that the occurrence of one event has no effect on the probability of the other, which can be rephrased in philosophical terms to mean that there is no causal relationship or that they are “informationally irrelevant” entities.
This can be said to be similar to the “atomic worldview” (like that of Democritus of ancient Greece), in which the world seems to consist of multiple elements happening in a disjointed manner and only by “coincidence”.
Also, from an information-theoretic perspective, assuming that A and B are independent is a declaration of ignorance that “knowing information about A does not tell us anything about B,” and that they may be related in reality, but since we cannot observe or control them, we consider them independent, the “smallest unit of rational modeling” It represents a point of view.
The other assumption, “that the variance is finite,” mathematically indicates that the following equation is finite.
\[Var(x)=E|(X-x)^2|\]
In philosophical terms, this is the belief that “there is a limit to the fluctuations of the world,” and that finite variance is based on the “ordered view of nature and the common sense view of the universe” in which “outliers (outliers) also occur, but within the bounds of common sense.
From another perspective, this viewpoint can be said to be in line with the scientific utilitarian viewpoint that “if the variance is infinite, it is unmeasurable, so it is assumed to be finite” and “the world is only the world that can be handled by humans. This perspective is also statistically connected to the law of large numbers, which states that “if you collect a large number of samples, they will converge to an average,” and to a worldview based on experience and accumulation, which states that “the world can be grasped stably if it is repeated.
It can be said that these conditions presuppose the following blueprint of the world.
- The world is intrinsically ordered, but that order is only probabilistically visible
- We do not have perfect knowledge, but we use the most reasonable model within our constraints
- We assume only the observable world and try to describe phenomena with simple laws
In contrast to this assumption, the real world is also a world in which one event or structure is “related” to another, and many real phenomena have a causal structure.
These are represented as network structures, and information, emotion, infection, influence, etc. propagate on these networks, making the world not an “independent set of points” but a “mutually influencing structure. In order to treat these as models, models based on probability distributions, such as Gaussian distributions, are not appropriate, and models that analyze graph structures, such as those described in “Graph Neural Networks,” are necessary.
In a world where extreme events occur frequently, it is often impossible to define even variance. This is mathematically represented by a distribution called the Pareto distribution (power distribution), which in the real world is represented by the distribution of wealth (the top 1% of the population is 40% of the total), the buzz on social networking sites (one post spreads a million times), the size of earthquakes (many small earthquakes, rarely a huge earthquake), the 9/11 attacks, the Lehman shock, There are events like the Corona pandemic that are recognized as “events that could not be predicted by historical data, but that have extreme consequences.
These events, which cannot even be measured in terms of variance, are called black swans (N. Taleb), and mathematical modeling of them requires an approach that goes beyond the conventional Gaussian view of the world.
The following approaches are mainly used to model these black swan-like phenomena.
| model approach | Overview | Keyword |
|---|---|---|
| Pareto and power distribution (heavy-tailed distribution) | Statistical consideration of “rare but significant” events | Scale-free, alpha-stable distribution |
| Extreme Value Theory | Statistical theory that deals only with the behavior of maxima and minima | GEV distribution, GPD distribution |
| Lévy process (jump process) | Random changes that jump around | Discontinuous and heavy-tailed distribution |
| Chaos Theory, Complex Systems | Dynamical systems in which minute initial differences produce huge changes | Initial condition acuteness/strangeness attractor |
| Agent-Based Model (ABM) | Sudden macro phenomena emerge from individual interactions | Phase transition/critical point |
| Black box model (AI/LLM) | Capturing signs and symptoms from large amounts of data without specifying causes | Anomaly detection and generation model |
AI approaches to these problems include the agent-based model (ABM) described in “Artificial Life and Agent Technology,” in which individual agents are driven by simple rules and their interactions are used to detect sudden changes in the overall structure, and the generative system model described in “Automatic Generation through Machine Learning. Recently, a black-box approach using models has been considered to “empirically detect and predict” black swans, rather than “theoretically explain” them. This can be described as a shift to a “seize the signs” perspective, rather than grasping the model as a whole.
Human history has been shaped by “exceptional” events, and while conventional science has tried to model “predictable and repeatable things,” this is a new approach that tries to predict unpredictable and one-time events.
Modeling is “the act of trying to give intelligent contours to the incomprehensible,” and it can be said that there are many different perspectives.
reference book
The following are references deeply related to the present discussion.
A. Foundations and Philosophy on Gaussian Distribution, Probability Theory and Central Limit Theorem.
| title | author | content |
|---|---|---|
| 『Foundations of the Theory of Probability: Second English Edition』 | Andrei Kolmogorov | Formal foundations of modern probability theory. Focuses on rigorous definitions of independence and variance. |
| 『Introduction to Probability and Statistics』 | ||
| 『Philosophy of Randomness』 |
B. Non-independent world, network, and causal models
| title | author | content |
|---|---|---|
| 『The Book of Why』 | Judea and Pearl | The ideological significance of causal graphs and Bayes nets by the father of causal inference. Non-independence = the core of causality. |
| 『Network Science』 | Albert-Lazlo Barabási | Systematic explanation of scale-free, link structure, Pareto law, and propagation of effects. |
| 『What is a complex system?』 |
C. Distributed infinite world, extreme value theory, black swan phenomenon.
| title | author | content |
|---|---|---|
| 『Reducing the Risk of Black Swans: Using the Science of Investing to Capture Returns with Less Volatility, 2018 Edition』 | Nassim Nicholas Taleb | Develops both philosophical and practical examples of the limits of the distributed infinite world view, Pareto distribution, and risk management. |
| 『Introduction to Extreme Value Theory: Applications to Risk Analysis and Management』 | ||
| 『The Misbehavior of Markets: A Fractal View of Financial Turbulence』 | Benuwa Mandelbrot. | Power laws, fractal geometry, and approaches to discontinuities in nature. |
D. Application to AI, Machine Learning, and Black Swan Detection
| title | author | content |
|---|---|---|
| 『Pattern Recognition and Machine Learning』 | Christopher M. Bishop | Mathematical background of Bayesian inference and Gaussian distributions, the core of AI-like probabilistic approaches such as Gaussian processes. |
| 『Deep Learning』 | Ian Goodfellow | Generative and predictive approaches to AI, including VAE, GAN, and other generative models. |
| 『Anomaly Detection: Through Machine Learning, Deep Learning and AutoML』 | ||
| 『artificial life』 |


AIシステム設計・意思決定構造の設計を専門としています。
Ontology・DSL・Behavior Treeによる判断の外部化、マルチエージェント構築に取り組んでいます。
Specialized in AI system design and decision-making architecture.
Focused on externalizing decision logic using Ontology, DSL, and Behavior Trees, and building multi-agent systems.


コメント