Javascript-based data visualization tool
D3.js and React, which are based on Javascript, can be used as tools for visualizing graph data and other relational data.
D3.js
D3.js (Data-Driven Documents Javascript) is a JavaScript library for rendering dynamic content in a web browser that was first developed in 2011. As a World Wide Web Consortium compliant data visualization tool, it makes the most of Scalable Vector Graphics (SVG), JavaScript, HTML5, and Cascading Style Sheets (CSS). In contrast to many other libraries, the final output will be one that allows visual adjustments to the result.
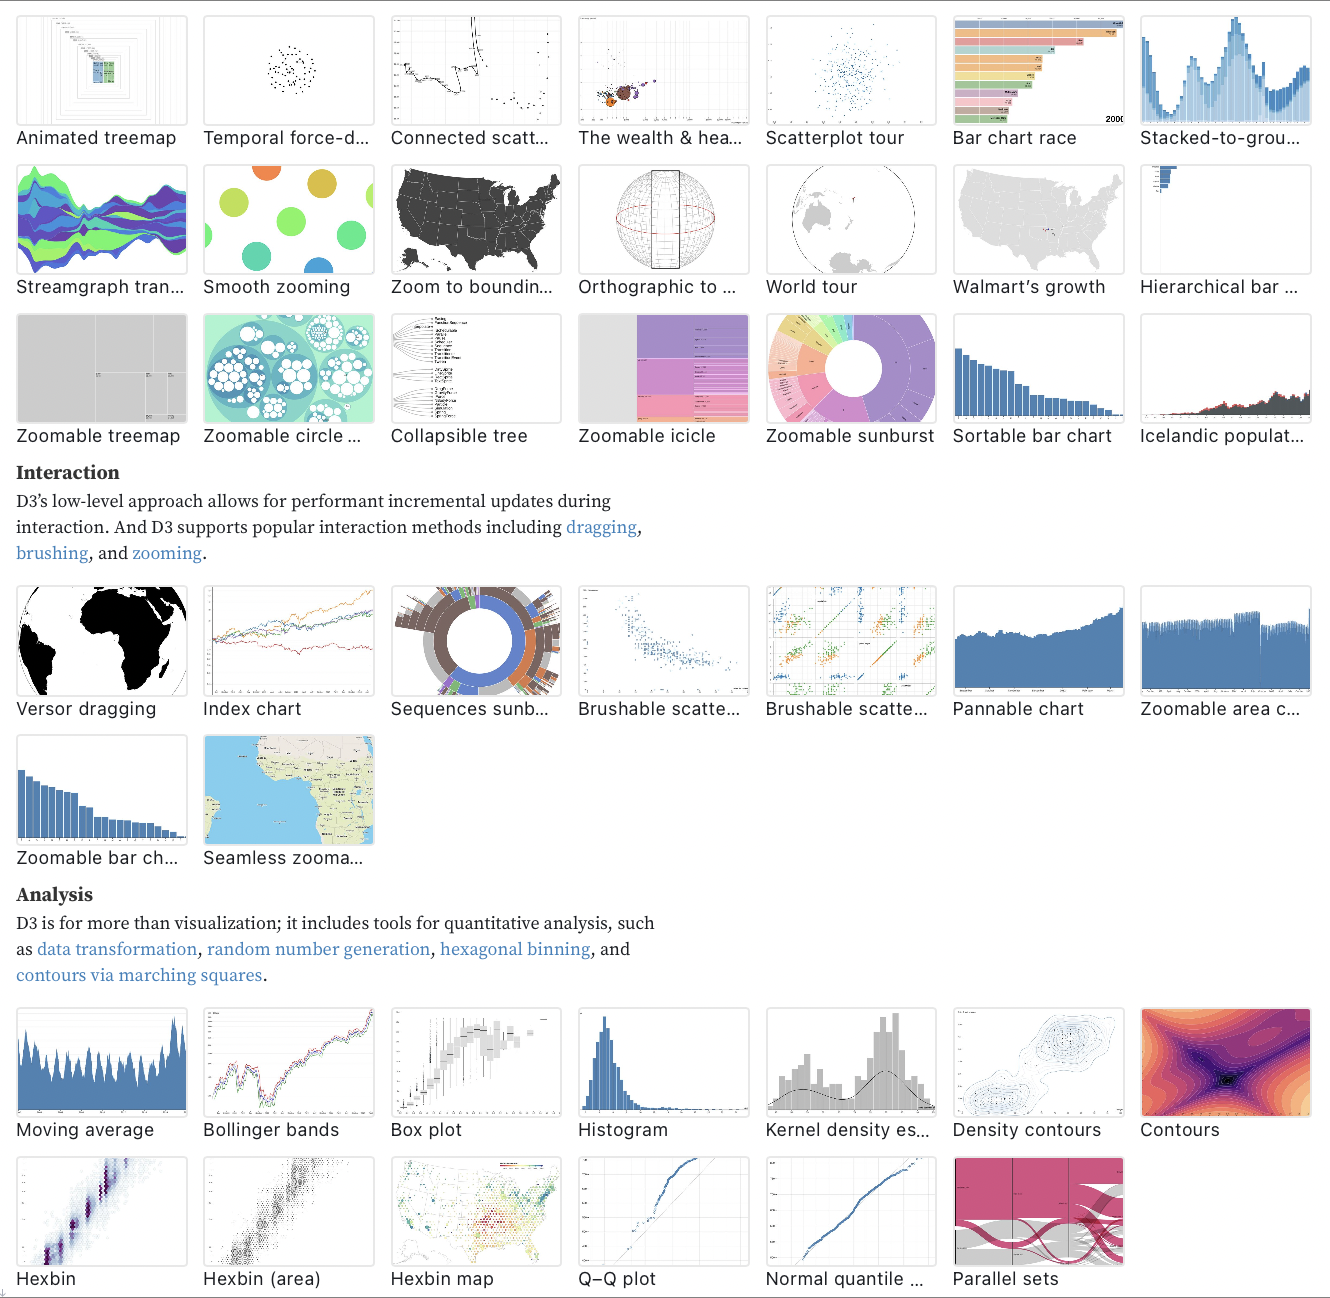
You can check out various samples in the gallery on the official page.

To use D3, download the library from the official page. At this time, instead of using source to access the git page, you can download the library from the top page under “Download the latest version (7.3.0) here:”. Prepare an html template file (index.html) as shown below, and create a js folder in the same folder to store the d3.min.js file.
<!DOCTYPE html>
<html>
<head>
<meta charset="utf-8">
<script type="text/javascript" src="js/d3.min.js"></script>
</head>
<body>
<svg id="MyGraph"></svg>
<script src="js/sample.js"></script>
</body>
</html>
Next, create a sample.js file in the js folder and write the following code.
var width = 200;
var height = 50;

d3.select("#MyGraph")
.append("rect")
.attr("x",10)
.attr("y",10)
.attr("width", width+"px")
.attr("height", height+"px")
.style("stroke","#000000")
.style("fill","#ffffff");
When you open the index.html file in your web browser, you will see a rectangle like the following.

The basic flow of these operations is to specify the attributes of SVG shapes in the above .js file, and then draw the specified shapes in d3.SVG(“#MyGraph”).
A typical method of using D3.js to visualize knowledge graphs (relational data) is to use force-graph. This displays data in the form of a graph as shown below.

As an approach other than D3, there are approaches using HTML5, and even simpler approaches using graph-viz, a Java library.
In addition, there is a heat map approach (two-dimensional display of relational data) for visualizing relationships. The following example shows the correlation between the characters in Les Misérables, and is equivalent to a symmetrical bipartite graph represented as a matrix.

In practical knowledge graphs, the relationships between data become more complex, and the two-dimensional display becomes too cumbersome to display, and when the number of data increases, there are cases where the processing becomes too heavy for normal Javascript.
Data visualization using React
There are also approaches that use virtual DOMs such as React to deal with these problems, and while there have been introductions to using D3 with React, this article will focus purely on methods that use React.
In order to use React, you need to install Node.js, a Javascript server framework.

Download and install the LTS for the respective OS. You don’t need to configure much details during the installation, just follow the instructions to complete the installation. (You can check if the installation is complete by typing “node -v” on the command line to display the version.)
Now you need to set up a separate proxy configuration in the following npm if you are connected to the corporate network (Proxy environment. Here is the address of the proxy server: http://proxyserver:8080として設定している. If you are using a network within your company, you can check the names of those proxy servers from the preferences. (If you are not in a proxy, this is not necessary.)
npm -g config set proxy http://proxyserver:8080
npm -g config set https-proxy http://proxyserver:8080
npm -g config set registry http://registry.npmjs.org/
npm config list
In addition, install “npm” and “yarn” as package management tools. (-g is a setting for global use).
// install npm
sudo npm install -g npm

//install yarn
npm install -g yarn
In addition, install the “create-react-app” tool to create a standard react template.
npm install -g create-react-appAt this stage, you can create a React app template by creating a standard react template under a folder of your choice.
create-react-app test-sample01
cd test-sample01
npm start
If your browser starts up automatically (if it doesn’t, go to “http://localhost:3000”) and you see the following screen, you have succeeded.

If you go to the official page of force-graph in React, you will see that there are three libraries: react-force-graph-2d, react-force-graph-3d, react-force-graph-vr and react-force-graph-ar. There are three libraries: react-force-graph-2d, react-force-graph-3d, react-force-graph-vr and react-force-graph-ar. There are libraries for normal 2D display, 3D display, VR and AR.
Install each of them using yarn as needed.
yarn install react-force-graph-2d
yarn install react-force-graph-3d
yarn install react-force-graph-vr
yarn install react-force-graph-ar
Go to the page about the example of 2D force-graph and try to create a simple sample. For example, modify the code in the previous template by referring to the “Force Graph 2D Charge” code.
The structure of the template folder is as follows.

Of these, “Index.html” is the main HTML file. Index.js” is the main javascript file, and React can be built by modifying the “App.js” file (and “App.css”). In this article, we will use each of them.
//App.js
import React, { useRef, useEffect } from "react";
import ReactDOM from "react-dom";
import ForceGraph2D from "react-force-graph-2d";
import "./App.css";
var data = {
nodes: [{ id: "A" }, { id: "B" }, { id: "C" }, { id: "D" }],
links: [
{ source: "B", target: "C", value: 8 },
{ source: "C", target: "D", value: 10 },
{ source: "D", target: "A", value: 6 },
{ source: "B", target: "A", value: 6 },
{ source: "B", target: "D", value: 6 },
{ source: "D", target: "D", value: 6, curvature: 0.3 }
]
};
function App() {
const forceRef = useRef(null);
useEffect(() => {
forceRef.current.d3Force("charge").strength(-400);
});
return (
and
//App.css
.App {
  font-family: sans-serif;
  text-align: center;
}
Change to When you run “npm start”, you will see a simple two-dimensional force-graph as shown below.

A further direction to improve them is to use strings for nodes.

A more complex structure of the node itself.

For more information, please refer to the code at the respective links.
The following is a simple example of 3D representation. As a sample code, we will use “force-graph-transparent-background“.
For App.js in the previous template
//App.js
import "./App.css";

import ForceGraph3d from "react-force-graph-3d";

// Random data
const N = 30;
const gData = {
  nodes: [...Array(N).keys()].map((i) => ({ id: i })),
  links: [...Array(N).keys()]
    .filter((id) => id)
    .map((id) => ({
      source: id,
      target: Math.round(Math.random() * (id - 1))
    }))
};

export default function App() {
  return (
     "red"}
      linkColor={() => "blue"}
      graphData={gData}
    />
  );
}
and
//App.css
body {
margin: 0;
}
When you “npm start” as shown below, you will see the graph data in a 3D display.

In the direction of further customization of the above, the use of image information (thumbnails) in the node section is suggested as a sample.

Several libraries have been presented for Heat-Map using React.
There are also applications such as visualization of software library dependencies as visualization using force-graph.

Treevis.net also has a survey classification of various tree information visualizations.
Reference Book
“

“

“

“


コメント