Overview of Geospatial Information Processing Technology
Geospatial information processing technology is a technology for handling geospatial information. Geospatial information is information for expressing a certain location on the earth and spatial information, which includes location information, topographic maps, satellite images, and satellite positioning information.
Geospatial information processing technology includes geographic information systems (GIS) and remote sensing technology.
GIS (Geographic Information System) is a system for handling geospatial information, which can collect, store, manage, and analyze maps and spatial data. By utilizing this GIS, it is possible to do the following
- Creation of maps: GIS is used to create maps to visualize geographic information. Maps are created based on data with location information.
- Spatial data management: GIS is used to collect, manage, process, and analyze spatial data; by manipulating spatial data in GIS, spatial trends and patterns can be identified.
- Spatial analysis: GIS is used for spatial analysis; GIS allows one to analyze data with location information and to analyze relationships between geographically or characteristically close objects.
These allow GIS to be used in a variety of fields, including urban planning, environmental conservation, land use, transportation, disaster management, agriculture, forestry, and fisheries. GIS also plays an important role in the field of providing location-based services and applications in combination with the Internet, smartphones, and in-vehicle navigation systems.
Remote sensing is a technology to collect information on the earth’s surface and atmosphere by acquiring image data from sensors such as earth observation satellites and aircraft. The information collected by remote sensing includes a variety of global-scale information such as the state of the earth’s surface, vegetation, topography, climate, ocean temperature and salinity, and so on.
In remote sensing, sensors measure electromagnetic waves emitted by materials on the earth and collect this information as digital data. The collected data can be used for image processing and analysis to determine the conditions and characteristics of the earth’s surface.
Remote sensing is used in a wide variety of fields, including weather forecasting, agricultural production, natural disaster monitoring, and environmental conservation. For example, in agriculture, understanding the condition of the land and vegetation can be used to determine the appropriate type of crop and amount of fertilizer to apply. In the case of natural disasters, understanding the extent of damage from floods and earthquakes enables rapid deployment of relief efforts.
By applying artificial intelligence technology to this geospatial information processing technology, it will be possible to collect, analyze, and predict more advanced geospatial information, such as the following
- Image analysis: Image data collected from earth observation satellites and drones can be automatically analyzed using artificial intelligence technology. This can be achieved, for example, by using image recognition technology based on deep learning to automatically detect buildings, roads, and other geographic features.
- Terrain Classification: Topographic classification technology using machine learning can be used to automatically determine the type of terrain, slope, etc. This can be used for land use planning, disaster risk management, etc. This enables land use planning, disaster risk mapping, etc.
- Route optimization: Route optimization technology using artificial intelligence techniques can automatically calculate optimal routes that take into account delivery routes and traffic congestion.
- Predictive modeling: Predictive models can be created using machine learning based on historical geospatial information. This can be useful, for example, in predicting the probability of earthquakes or the occurrence of weather disasters.
- Automatic generation of geographic information: Automatic maps can be generated from aerial photos and satellite images using deep learning-based automatic mapping technology.
This blog discusses the following aspects of geospatial information
About geospatial information processing
From Iwanami Data Science vol. 4, “Geospatial Information Processing.
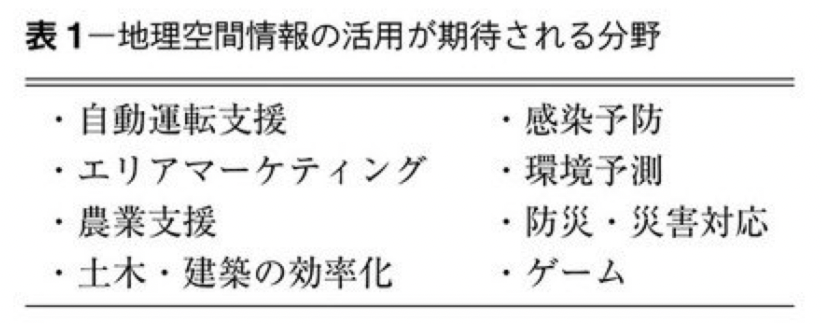
The term “geospatial information” refers to information about location or information that is linked to location. For example, it is said that 80% of the information handled by the government used for LOD is linked to some kind of location information, and if the location where the information was generated is recorded together with the information, all the information can be called “geospatial information.
By handling information in connection with location, it is possible to grasp the distribution of information even by simply plotting location information on a map, and if there is data on roads and destinations connected to latitude and longitude using GPS, it is possible to guide a person with a GPS terminal to a desired location, and to track the movements of the person. If you have data on roads and destinations linked to latitude and longitude, you can guide a person with a GPS device to a desired location, or track his or her movements. It is also possible to provide services based on location with information about future events.
By making good use of these features of location information, it will be possible to make new scientific discoveries, develop services in business, and solve various social problems.

In this blog, I discuss the following contents regarding these geospatial information.
Implementation
Geographic Information Processing (GIP) refers to technologies and methods for acquiring, managing, analyzing, and displaying information about geographic locations and spatial data, and is widely used in the fields of Geographic Information Systems (GIS) and It is widely used in the field of Geographic Information Systems (GIS) and Location-based Systems (LBS). This section describes various applications of geographic information processing and concrete examples of implementation in python.
- Overview of DBSCAN (Density-Based Spatial Clustering of Applications with Noise) and Examples of Applications and Implementations
DBSCAN is a popular clustering algorithm in data mining and machine learning that aims to discover clusters based on the spatial density of data points rather than assuming the shape of the clusters. This section provides an overview of this DBSCAN, its algorithm, various application examples, and a concrete implementation in python.
Technical Topics
GIS (Geographical Information System) is a system that can display superimposed geospatial information, process the information, and perform some kind of analysis on the superimposed information to help determine the situation.
There are two types of systems for displaying geospatial information: GIS software that runs on a desktop, and web maps that run on a browser. As for GIS running on the desktop, there is ArcGIS by ERIS, which is paid for, and QGIS, which is open source software. These offer a wide range of editing and analysis functions. On the other hand, Google Maps and other web maps are good at displaying and overlaying information, but most of them do not provide editing and analysis functions, or only simple ones. Therefore, it is essential to distinguish between desktop GIS and web maps depending on how to utilize geospatial information.
Here, we show an example of creating a map of the estimated population of evacuees for each evacuation facility in the Kumamoto earthquake that occurred in 2016.
If you want to do more in-depth analysis, such as numerically understanding regional trends or statistically predicting situations based on the attribute information of location data, you can consider using the statistical processing software R. In addition, if you want to automate the processing of location data, you can use the R language to describe a series of processes for data processing because R has a full range of packages for handling geographic information.
In this paper, we describe how to import GIS-processed location data into R, how to automate the analysis and processing of location data, and how to improve the processing by using OpenStreetMap data. To handle location data in R, you need to install packages such as sp, rgdal, maptools, and raster.
A “cholopleth map” is a map with each section of the map painted in a different color according to the corresponding statistical values. In some cases, the statistical values used for coloring are directly based on surveyed data, and in other cases, they are estimated from observed data. A corroboration map is used to visualize the numerical values of each region in combination with geographic (spatial) information.
In this section, we will explain how to use geographic neighboring information represented on a map to perform estimation using a hierarchical Bayesian model that takes spatial correlation into account, and visualize the result on a map as a coropres map.
Customer flow line refers to the route and movement information that customers take in a store, and customer flow line research is a store management method that combines various data such as sales data and customer data with customer flow line data to design store layouts and improve the efficiency of store promotions.
The in-store behavior of customers, which is the theme of this article, can be generated based on the time-series information of customers in the store, such as visit probability, drop-in rate, and sales floor visit order. In order to quantitatively measure the results that such in-store behavior brings to business, various indicators such as purchase probability and sales amount can be used. The causal relationship between the in-store behavior of these customers and the results of their purchasing behavior is greatly influenced by the environment. In addition to time of day, store location, etc., differences in sales promotion, personal attributes, etc. can cause serious differences.
For these analyses, we will discuss the use of HMM, a probabilistic model, k-medoids, which is a modification of k-means, and fractal dimensional kernel density estimation methods.
Epidemiology is a field of study that investigates the frequency and distribution of health-related events in specific populations, elucidates the factors involved, and applies the research results to the prevention and control of health problems. In particular, epidemiological research that uses spatial data is called “spatial epidemiology,” and since it uses maps and location information, it is attracting attention as a research field that is closely related to geographic information systems (GIS).
When dealing with data collected in a certain regional unit, such as prefectures or health centers, if we consider only the number of observations, the number will naturally tend to be larger in areas with a large population. In addition, the age structure of the local population may have an impact on some diseases, and a simple comparison of the number of observations or the number of observations per population divided by the population of the area may be insufficient. For this reason, disease maps using standardized risk indicators are often used to remove the effects of age and other factors as well as population differences. The Standard Morbidity Ratio (SMR), an indirect method, is one of the most commonly used.
In addition, Bayesian estimates are sometimes used for inter-regional comparisons in order to take into account the accuracy of the estimation of risk indicators in the region. In this study, we used the Poisson-Gamma model of SMR to estimate the empirical Bayesian estimates of the number of cases in each prefecture and health center, using Japan as the reference population and adjusting for the age structure.
With the advent of social media such as Twitter, which began to spread rapidly around 2010, the data available on the web is not just text, but also time (date) information, geographic information (GPS information), images, audio information, and other multiple modalities.
These technological advances have made it possible to collect a large amount of information such as “who, when, where, and what” (hereafter referred to as event information), and have opened up a huge amount of potential outlets in the area of natural language processing, which previously had only a limited number of applications.
Research in the area of identifying natural and social phenomena by considering people who are sending out information through social media as if they were some kind of sensors is sometimes called research using social sensors.
In contrast, in recent years, statistical methods for word selection have been explored. For example, to collect as many statements as possible and extract words that are highly correlated with the number of influenza cases, we can use dimension compression, regression models, topic models that consider the number of cases as a kind of topic, and mRMR (reducing redundancy) to lower the correlation between the words to be collected. We are also trying to use feature selection weekly reports such as mRMR (minimum redundancy maximum relevance) to reduce the correlation between words to be collected.
It is conceivable to combine real-time observation-based mobile terminals with mesh-based aggregated population data by time and flow data for urban areas based on PT data to obtain real-time estimated flows of people. These approaches are also known as data assimilation, in the sense that they integrate simulation models and observation data, and have the advantage that future predictions that cannot be obtained from observation data can be made from the models.
Specifically, we use a state-space model with “the location of people in the city as the action” as the state variable, and assimilate the data using a particle filter. When the observed data is obtained, the likelihood (goodness of fit to the observed data) of each particle is calculated, and the particles are sampled and weighted by the likelihood. The likelihood is then used to predict the next time. The simulation is based on the assumption that the destination of each person is given to some extent based on the past PT data, and the speed and other factors are changed based on the traffic conditions to that destination.
With the widespread use of smartphones, it has become easier to obtain our location information, and a variety of location-based social network services have been provided. The machines for secondary use of such location information analysis and utilization are spreading to various fields, and are being used for social services such as traffic information provision and urban design, as well as for commercial businesses such as trade zone analysis.
On the other hand, there is a risk that location information may reveal information related to privacy, such as personal habits, interests, behaviors, and social sphere. In order for location information to be used safely by third parties, the party providing the data needs to process the data, called anonymization, to protect privacy.
The current security standard for anonymization only requires the format of the anonymized data, and does not guarantee sufficient security. In this paper, I will point out the problems in applying widely used anonymization techniques to location information, and describe a statistical method based on Markov models for evaluating the security of anonymization methods.
In recent years, drones have been put to practical use in various fields such as transportation, agriculture, surveying, and disaster prevention, and they have also become an important technology in geospatial information. Drones are small unmanned aerial vehicles (UAVs) that can be remotely controlled by radio and can fly along set courses. UAVs can approach dangerous areas, such as disaster sites, unmanned, and take detailed pictures of the situation with their onboard cameras.
On the other hand, recent advances in computer vision technology and improvements in computer performance have made it possible to automatically reconstruct the shape of an object in three dimensions from a large number of images taken by a camera. This technique is called SfM (Structure from Motion) and MVS (Multi view Stereo). By combining this 3D model restoration technique with images taken by drones, terrain models and ornate images can be created quickly and easily.
In marketing activities, the effectiveness of advertisements and promotions is always a problem, and in order to make improvements through the PDCA cycle, the effectiveness of advertisements must be properly understood and verified. In this issue, we will introduce the types and characteristics of OOH (outdoor advertising), which is said to be one of the most difficult types of advertising to measure effectiveness, and explain how to achieve OOH effectiveness measurement.
First order logic (FOL) rewritability is a desirable feature for query answering over geo-thematic ontologies because in most geoprocessing scenarios one has to cope with large data volumes. Hence, there is a need for combined geo-thematic logics that provide a sufficiently expressive query language allowing for FOL rewritability. The DL-Lite family of description logics is tailored towards FOL rewritability of query answering for unions of conjunctive queries, hence it is a suitable candidate for the thematic component of a combined geo-thematic logic. We show that a weak coupling of DL-Lite with the expressive region connection calculus RCC8 allows for FOL rewritability under a spatial completeness condition for the ABox. Stronger couplings allowing for FOL rewritability are possible only for spatial calculi as weak as the low-resolution calculus RCC2. Already a strong combination of DL-Lite with the low-resolution calculus RCC3 does not allow for FOL rewritability
Our work is settled in the context of the public administration domain, where data can come from different entities, can be produced, stored and delivered in different formats and can have different levels of quality. Hence, such a heterogeneity has to be addressed, while performing various data integration tasks. We report our experimental work on publishing some government linked open geo-metadata and geo-data of the Italian Trentino region. Specifically, we illustrate how 161 core geographic datasets were released by leveraging on the geo-catalogue application within the existing geo-portal. We discuss the lessons we learned from deploying and using the application as well as from the released datasets.
The discovery of links between resources within knowledge bases is of crucial importance to realize the vision of the Semantic Web. Addressing this task is especially challenging when dealing with geo-spatial datasets due to their sheer size and the potential complexity of single geo-spatial objects. Yet, so far, little attention has been paid to the characteristics of geo-spatial data within the context of link discovery. In this paper, we address this gap by presenting Orchid, a reduction-ratio-optimal link discovery approach designed especially for geospatial data. Orchid relies on a combination of the Hausdorff and orthodromic metrics to compute the distance between geo-spatial objects. We first present two novel approaches for the efficient computation of Hausdorff distances. Then, we present the space tiling approach implemented by Orchid and prove that it is optimal with respect to the reduction ratio that it can achieve. The evaluation of our approaches is carried out on three real datasets of different size and complexity. Our results suggest that our approaches to the computation of Hausdorff distances require two orders of magnitude less orthodromic distances computations to compare geographical data. Moreover, they require two orders of magnitude less time than a naive approach to achieve this goal. Finally, our results indicate that Orchid scales to large datasets while outperforming the state of the art significantly.
Geospatial extensions of SPARQL like GeoSPARQL and stSPARQL have recently been defined and corresponding geospatial RDF stores have been implemented. However, there is no widely used benchmark for evaluating geospatial RDF stores which takes into account recent advances to the state of the art in this area. In this paper, we develop a benchmark, called Geographica, which uses both real-world and synthetic data to test the offered functionality and the performance of some prominent geospatial RDF stores.
We extend YAGO2 with geospatial information represented by geometries (e.g., lines, polygons, multipolygons, etc.) encoded by Open Geospatial Consortium standards. The new geospatial informa- tion comes from official sources such as the administrative divisions of countries but also from volunteered open data of OpenStreetMap. The resulting knowledge graph is currently the richest in terms of geospatial information publicly available, open source, knowledge graph
In the era of big data, a vast amount of geospatial data has become available originating from a large diversity of sources. In most cases, this data does not follow the linked data paradigm and the existing transformation tools have been proved ineffective due to the large volume and velocity of geospatial data. This is because none of the existing tools can utilize effectively the processing power of clusters of computers. We present the system GeoTriples-Spark which is able to massively transform big geospatial data into RDF graphs using Apache Spark. We evaluate GeoTriple-Spark’s performance and scalability in standalone and dis- tributed environments and show that it exhibits superior performance and scalability when compared to all of its competitors.
We introduce an approach to semantically represent and query raster data in a Semantic Web graph. We extend the GeoSPARQL vocabulary and query language to support raster data as a new type of geospatial data. We define new filter functions and illustrate our approach using several use cases on real-world data sets. Finally, we describe a prototypical implementation and validate the feasibility of our approach.
Ontology alignment has been studied for over a decade, and over that time many alignment systems and methods have been developed by researchers in order to find simple 1-to-1 equivalence matches between two ontologies. However, very few alignment systems focus on finding complex correspondences. One reason for this limitation may be that there are no widely accepted alignment benchmarks that contain such complex relationships. In this paper, we propose a real-world dataset from the GeoLink project as a potential complex alignment benchmark. The dataset consists of two ontologies, the GeoLink Base Ontology (gbo) and the GeoLink Modular Ontology (gmo), as well as a manually created reference alignment, that were developed in consultation with domain experts from different institutions. The alignment includes 1:1, 1:n, and m:n equivalence and subsumption correspondences, and is available in both EDOAL and rules syntax.
- ReQuLGD: Representation and Querying for Linked Geospatial Data
- Neural Embeddings for Populated Geonames Locations
The application of neural embedding algorithms (based on architectures like skip-grams) to large knowledge bases like Wikipedia and the Google News Corpus has tremendously benefited multiple com- munities in applications as diverse as sentiment analysis, named entity recognition and text classification. In this paper, we present a similar resource for geospatial applications. We systematically construct a weighted network that spans all populated places in Geonames. Using a network embedding algorithm that was recently found to achieve excellent results and is based on the skip-gram model, we embed each populated place into a 100-dimensional vector space, in a similar vein as the GloVe embeddings released for Wikipedia. We demonstrate potential applications of this dataset resource, which we release under a public license.
Data.geohive.ie aims to provide an authoritative service for serving Ireland’s national geospatial data as Linked Data. The service currently provides information on Irish administrative boundaries and the boundaries used for the Irish 2011 census. The service is designed to support two use cases: serving boundary data of geographic features at various level of detail and capturing the evolution of administrative boundaries. In this paper, we report on the development of the service and elaborate on some of the informed decisions concerned with the URI strategy and use of named graphs for the support of aforementioned use cases – relating those with similar initiatives. While clear insights on how the data is being used are still being gathered, we provide examples of how and where this geospatial Linked Data dataset is used.
We propose an OBDA approach for accessing geospatial data stored in relational databases, using the OGC standard GeoSPARQL and R2RML or OBDA mappings. We introduce extensions to an existing SPARQL-to-SQL translation method to support GeoSPARQL features. We describe the implementation of our approach in the system ontop-spatial, an extension of the OBDA system Ontop for creating virtual geospatial RDF graphs on top of geospatial relational databases. We present an experimental evaluation of our system using and extending a state-of-the-art benchmark. To measure the performance of our system, we compare it to a state-of-the-art geospatial RDF store and confirm its efficiency.
While the geographical domain has long been involved as an important part of the Linked Data, the small amount of Chinese linked geographical data impedes the integration and sharing of both Chinese and cross-lingual knowledge. In this paper, we contribute to the development of a new Chinese linked geographical dataset named Clinga, by obtaining data from the largest Chinese wiki encyclopedia. We manually design a new geography ontology to categorize a wide range of physical and human geographical entities, and carry out an automatic discovery of links to existing knowledge bases. The resulted dataset contains over half million Chinese geographical entities and is open access.
YAGO is a large knowledge base that is built automatically from Wikipedia, WordNet and GeoNames. The project combines information from Wikipedias in 10 different languages into a coherent whole, thus giving the knowledge a multilingual dimension. It also attaches spatial and temporal information to many facts, and thus allows the user to query the data over space and time. YAGO focuses on extraction quality and achieves a manually evaluated precision of 95 %. In this paper, we explain how YAGO is built from its sources, how its quality is evaluated, how a user can access it, and how other projects utilize it.
GeoLink is one of the building block projects within EarthCube, a major effort of the National Science Foundation to establish a next-generation knowledge infrastructure for geosciences. As part of this effort, GeoLink aims to improve data retrieval, reuse, and integration of seven geoscience data repositories through the use of ontologies. In this paper, we report on the GeoLink modular ontology, which consists of an interlinked collection of ontology design patterns engineered as the result of a collaborative modeling effort. We explain our design choices, present selected modeling details, and discuss how data integration can be achieved using the patterns while respecting the existing heterogeneity within the participating repositories.

コメント