Clustering with R – k-means
In the previous article, I introduced hierarchical clustering as an example of clustering in R. In this article, we will introduce k-means, a non-hierarchical clustering.
The kmeans function is as follows.
> kmeans(x, centers, iter.max = 10, nstart = 1,algorithm = c("Hartigan-Wong", "Lloyd", "Forgy", "MacQueen"))The function kmeans returns the result of cluster classification ($cluster), the cluster center vector ($centers), the number of individuals in each cluster ($size), and so on. In the above function, x is the data, centers is the number of clusters or the center of the cluster, and if it is the number of clusters, the center of the cluster is given randomly. iter.max is the maximum number of iterations of the process. nstart is a parameter to set the initial value randomly. algorithm is a computational algorithm (“Hartigan-Wong”, “Lloyd”, “Forgy”, “MacQueen”) . The default value is “Hartigan-Wong”. kmean is executed using the iris data, and after the function kmeans is executed, the result of cluster classification is recorded in km$cluster.
> data <- iris[,1:4]
> km <- kmeans(data,3)
> result <- km$cluster
> result
  [1] 3 3 3 3 3 3 3 3 3 3 3 3 3 3 3 3 3 3 3 3 3 3 3 3 3 3 3 3 3 3 3 3 3 3 3
 [36] 3 3 3 3 3 3 3 3 3 3 3 3 3 3 3 2 2 1 2 2 2 2 2 2 2 2 2 2 2 2 2 2 2 2 2
 [71] 2 2 2 2 2 2 2 1 2 2 2 2 2 2 2 2 2 2 2 2 2 2 2 2 2 2 2 2 2 2 1 2 1 1 1
[106] 1 2 1 1 1 1 1 1 2 2 1 1 1 1 2 1 2 1 2 1 1 2 2 1 1 1 1 1 2 1 1 1 1 2 1
[141] 1 1 2 1 1 1 2 1 1 2
Load the cluster package and plot the clustering results.
> install.packages("cluster")
> library(cluster)
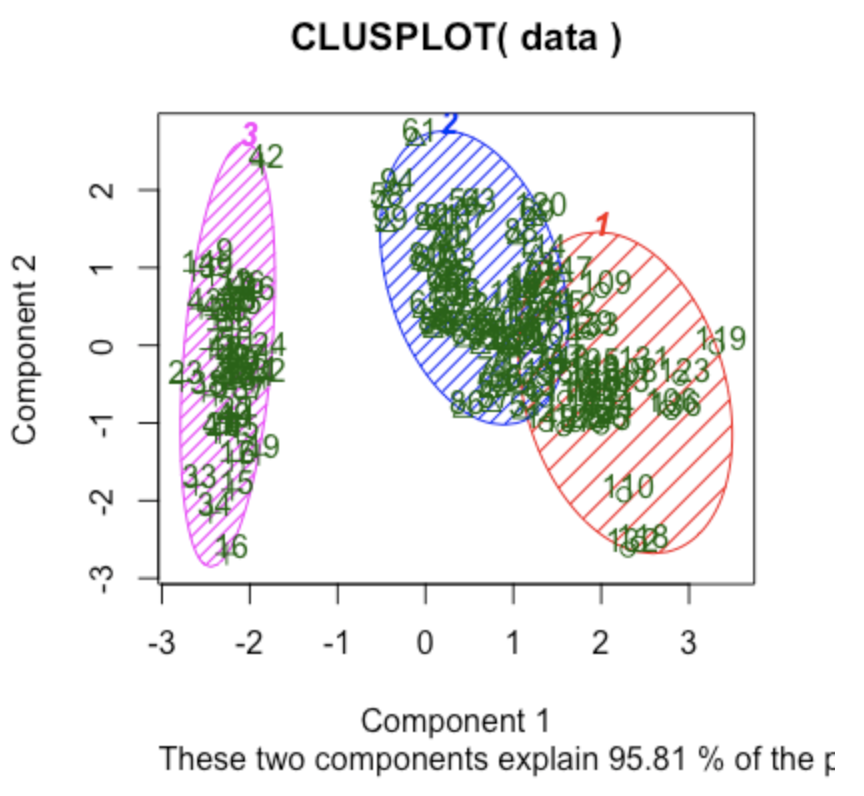
> clusplot(data, km$cluster, color=TRUE, shade=TRUE, labels=2, lines=0)
Substitute the data of Species in the fifth column of iris data into the variable answer, create a cross table of varieties and clustering results, and confirm the classification accuracy.
> answer <- iris[,5]
> table <- table(answer, result)
> table
            result
answer        1  2  3
  setosa      0  0 50
  versicolor  2 48  0
  virginica  36 14  0
From the cross table, we can see that out of 150 samples, (50+48+36=)134 samples were correctly classified.
In the above example, we used iris to process the data, but it is also possible to generate and process data from real-world issues using similar methods, such as using the morphological analysis tool introduced in the Natural Language Processing section to extract words from sentences, and then input the data with each word numbered as CSV for clustering. The same method can be used to generate and process data from real-world tasks.
In this article, I have described classification using k-means, which is unsupervised learning. In addition to these, classification using supervised learning is also often used for classification tasks.
For more information on k-means in python, please refer to “Overview of k-means, its applications, and implementation examples“.
In the next article, I will introduce openrefine, a preprocessing tool that is indispensable for these machine learning and natural language processing tasks.

コメント