Summary
From “Microservice with Clojure. In the previous article, we discussed security in microservices using APIs with Auth and Pedestal in Clojure. In this article, we will discuss the use of ElasticStash for monitoring microservice systems.
The monitoring system described here can be widely applied to systems other than microservices. For more information on using ElasticStash for search engines, please refer to “Search Tool Elasticsearch – Startup Procedure“.
Microservice Monitoring
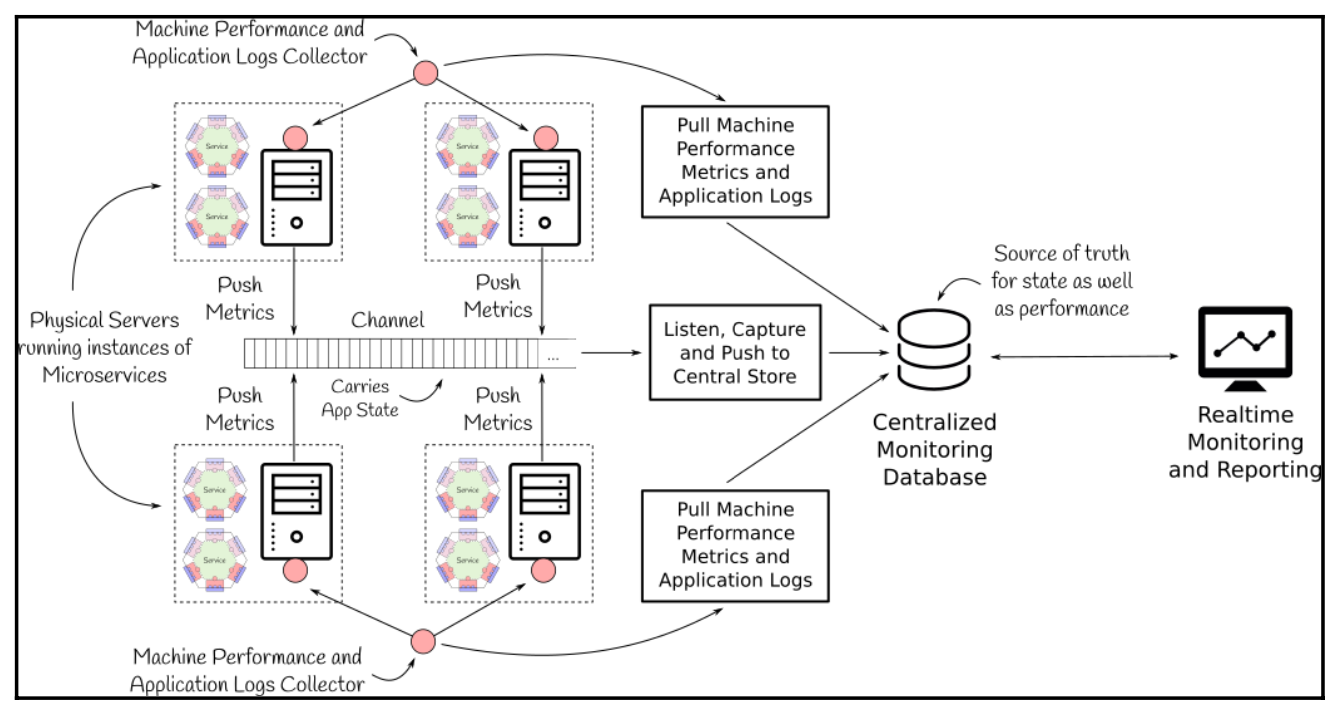
Microservice-based applications are very flexible in terms of deployment and scaling. It may consist of multiple services, with one or more instances running on a cluster of machines on a network. In such a highly distributed and flexible environment, it is of paramount importance to monitor each instance of the microservice in real time to get a clear picture of the deployed services and their performance, and to identify any concerns that should be reported as soon as a problem occurs. Since each request to a microservice-based application may be spread across one or more microservices, areas of bottlenecks that can be addressed by tracking the flow of requests, performing root cause analysis, and further scaling the service to meet demand A mechanism is needed to identify

One way to build an effective monitoring system would be to collect all metrics across services and machines and store them in a centralized repository, as shown in the previous figure. This centralized repository would support analysis of the collected metrics and help generate real-time alerts for events of interest. The centralized repository would also help in setting up a real-time view of the system to understand the behavior of each service and decide whether to scale up or scale down. To set up a centralized repository for an application, metrics must be pulled from all services and physical machines or pushed to the centralized repository from services running on physical machines.
All services need to push metrics related to the application state to a common channel, such as Apache Kafka, with a common topic. This channel can then be used to aggregate all application-level metrics across services and store them in a centralized repository. Application-level logs written to files on physical servers or application-level metrics published through a medium such as JMX can be retrieved by an external collector and later pushed to central storage. To monitor infrastructure performance, the external collector also needs to retrieve physical machine statistics, including CPU utilization, network throughput, disk I/O, etc., which can also be pushed to a central repository for overall resource utilization across application services. understanding of the application’s overall resource utilization.
Use ELK Stack for monitoring
Elasticsearch、LogStash、Kibana, called the ELK Stack or Elastic Stack, create a real-time monitoring infrastructure to capture, pull, push to a central repository, and build monitoring dashboards for reports and alerts. It has all the components. They will be used to build a real-time monitoring infrastructure to capture and push application and machine level metrics to a centralized reporty. The monitoring infrastructure diagram below shows how each component of the ELK Stack is positioned; although Collectd and Apache Kafka are not part of the ELK Stack, the ELK Stack provides seamless integration with them.

Collectd helps capture all machine-level statistics, including CPU, memory, disk, and network. The captured data is pulled through Logstash and pushed to Elasticsearch.
By pushing to Elasticsearch, the overall performance and utilization of the infrastructure used by the application’s services can be analyzed. Logstash also integrates well with Apache Kafka to capture application state events exposed by the service and push them directly to Elasticsearch. Since Elasticsearch serves as the central repository for all logs, events, and machine statistics, Kibana can be used directly on top of Elasticsearch to analyze stored metrics and It is possible to build dashboards that are updated in real time as events arrive in Elasticsearch. It would also be possible to use Kibana to perform root cause analysis and generate alerts to intended recipients.
While the ELK Stack is useful for monitoring, it is not the only option; tools such as Prometheus can also be used for monitoring; Prometheus supports dimensional data models, flexible query languages, efficient time series databases, and has alerting Built-in.
Setting up Elasticsearch
To configure Elasticsearch, download the latest version from the Elasticsearch download page and deploy as shown in the example below. In this case, Elasticsearch 6.1.1 will be used.
# download elasticsearch 6.1.1 tar
> wget https://artifacts.elastic.co/downloads/elasticsearch/elasticsearch-6.1.1.ta r.gz

# extract the downloaded tarball
> tar -xvf elasticsearch-6.1.1.tar.gz
# make sure that these directories are present
> tree -L 1 elasticsearch-6.1.1
elasticsearch-6.1.1
├── bin
├── config
├── lib
├── LICENSE.txt ├── modules
├── NOTICE.txt ├── plugins
└── README.textile
5 directories, 3 files
While Elasticsearch can be run out-of-the-box with the bin/elasticsearch command, it is recommended that you review the following important configuration and system settings to ensure effective operation of your Elasticsearch cluster. The settings marked “ES Config” are those common to all Elasticsearch deployments, and those marked “System Setting” are those for the Linux operating system. The environment variable -$ES_HOME- refers to the installation folder of the deployed Elasticsearch.
The environment variable -$ES_HOME- refers to the extracted Elasticsearch installation folder, i.e., elasticsearch-6.1.1 of the command shown in the previous code snippet.


It should be noted that some of the system settings listed in the previous table require a system reboot for them to take effect. Also, settings such as swap space should only be done when only Elasticsearch is running on the host OS. After all settings are complete, each Elasticsearch node can be started with the following command.
# change to the extracted elasticsearch directory
> cd elasticsearch-6.1.1
# start elasticsearch
> bin/elasticsearch
Note that the first node started is automatically chosen as the master of the cluster.
Once the Elasticsearch node is up and running, a GET request is sent to the default 9200 port of the machine running Elasticsearch using cURL to test the instance (see example above). You will then get a response indicating the version of the node. Verify that it is the correct version, which in this example is 6.1.1.
> curl http://localhost:9200
   {
     "name" : "W6r6s1z",
     "cluster_name" : "elasticsearch",
     "cluster_uuid" : "g33pKv6XRTaj_yMJLliL0Q",
     "version" : {
     "number" : "6.1.1",
     "build_hash" : "bd92e7f",
     "build_date" : "2017-12-17T20:23:25.338Z", "build_snapshot" : false,
     "lucene_version" : "7.1.0", "minimum_wire_compatibility_version" : "5.6.0", "minimum_index_compatibility_version" : "5.0.0"
  },
     "tagline" : "You Know, for Search"
   }
While the preceding configuration described a typical cluster deployment of Elasticsearch, Elasticsearch also has the concept of Cross Cluster Search, which allows any node to act as a federated client across multiple clusters of Elasticsearch.
Kibana Setup
Kibana is a visualization and dashboard interface for Elasticsearch that allows users to explore data and build real-time dashboards using the Discover module. Kibana allows you to build monitoring dashboards using a variety of metrics captured in Elasticsearch. Kibana can be used to build monitoring dashboards that utilize the various metrics captured within Elasticsearch.
To configure Kibana, download the latest version from the Kibana download page and deploy as shown in the example below. Kibana 6.1.1 will be used in this document.
# download Kibana 6.1.1 tar
> wget https://artifacts.elastic.co/downloads/kibana/kibana-6.1.1-linux-x86_64.tar .gz
# extract the downloaded tarball
> tar -xvf kibana-6.1.1-linux-x86_64.tar.gz
# make sure that these directories are present
> tree -L 1 kibana-6.1.1-linux-x86_64
kibana-6.1.1-linux-x86_64
├── bin
├── config
├── data
├── LICENSE.txt ├── node
├── node_modules ├── NOTICE.txt ├── optimize ├── package.json ├── plugins ├── README.txt ├── src
├── ui_framework └── webpackShims
10 directories, 4 files
Next, set the following configuration parameters in the $KIBANA_HOME/config/kibana.yml file to configure the Kibana instance: KIBANA_HOME/config/kibana.yml file. The environment variable $KIBANA_HOME points to the unzipped Kibana installation folder, i.e., kibana-6.1.1-linux-xml. kibana-6.1.1-linux-x86_64 (for the command shown in the previous code snippet).

Once everything is configured, start Kibana with the command shown in the following example. As shown in the previous table, verify that Elasticsearch is already running and that the Kibana node can be accessed with the configured elasticsearch.url setting.
# change to extracted kibana directory
> cd kibana-6.1.1-linux-x86_64
# start kibana
> bin/kibana
Once Kibana starts, open the Kibana interface in your browser at the URL http://localhost:5601, as shown in the following screenshot. The Kibana home page will appear with options for visualizing and exploring the data.

Kibana’s current configuration allows users to explore Elasticsearch in a closed network; since Kibana has full control over the underlying Elasticsearch cluster and the data stored within it, it is recommended that users connect and access their dashboards over It is recommended that SSL and the load balancing options defined in the production configuration be enabled in order to access the dashboard.
Logstash Setup
Logstash enables the collection, parsing, and conversion of log messages. It supports many input and output plug-ins so that Logstash can collect logs from a variety of sources, parse and convert them, and write the results to any of the supported plug-ins.To set up Logstash Download the latest version from the Logstash download page and extract it as shown in the following code snippet. We will use Logstash 6.1.1.
# download Logstash 6.1.1 tar
> wget https://artifacts.elastic.co/downloads/logstash/logstash-6.1.1.tar.gz
# extract the downloaded tarball
> tar -xvf logstash-6.1.1.tar.gz
# make sure that these directories are present
> tree -L 1 logstash-6.1.1
logstash-6.1.1
├── bin
├── config
├── CONTRIBUTORS ├── data
├── Gemfile
├── Gemfile.lock
├── lib
├── LICENSE
├── logstash-core
├── logstash-core-plugin-api ├── modules
├── NOTICE.TXT
├── tools
└── vendor
9 directories, 5 files
The following table lists the key configuration settings required for Logstash. The environment variable -$LOGSTASH_HOME- points to the extracted Logstash installation folder, i.e., logstash-6.1.1 for the command shown in the previous code snippet.


The preceding table lists only the major configuration parameters. For more details and all supported configuration parameters, see the Logstash Configuration File Guide. Once all configuration is complete, test the sample Logstash pipeline that receives messages using stdin as the input plugin and outputs incoming messages using stdout as the output plugin, as shown below.
# change to extracted logstash directory
> cd logstash-6.1.1
# start logstash pipeline by specifying the configuration
# at command line using the -e flag
> bin/logstash -e 'input { stdin { } } output { stdout {} }'
Logstash may take a few seconds to start the pipeline, so wait for the pipeline execution message to be logged. Once the pipeline is running, enter the message in the console and Logstash will echo the same on the console with the current timestamp and hostname appended. This is a very simple pipeline with no transformations, but it allows Logstash to apply transformations to the received message before outputting it to the sink. Similar to the basic pipeline shown in the previous test, a Logstash pipeline configuration is created for each pipeline that Logstash needs to run to retrieve logs, events, and data and store them on the target sink.
Logstash plug-ins are implemented primarily in Ruby. Therefore, all Logstash job configuration files and conversion constructs use Ruby syntax.
ELK Stack and Collectd together
Collectd will be a daemon that can be configured to collect metrics from various source plug-ins such as Logstash, etc. Compared to Logstash, Collectd is very lightweight and portable, but does not have the ability to generate graphs. However, it can write to RRD files, which can then be read using RRDTool to generate graphs and visualize the logged data. On the other hand, Collectd is written in C, which makes it possible to use it to collect metrics from embedded systems.
Collectd must be built from source. First, download and unzip Collectd 5.8.0.
# download Collectd 5.8.0 tar
> wget https://storage.googleapis.com/collectd-tarballs/collectd-5.8.0.tar.bz2
# extract the downloaded tarball
> tar -xvf collectd-5.8.0.tar.bz2
# make sure that these directories are present
> tree -L 1 collectd-5.8.0
collectd-5.8.0
├── aclocal.m4
├── AUTHORS
├── bindings
├── build-aux
├── ChangeLog
├── configure
├── configure.ac
├── contrib
├── COPYING
├── m4
├── Makefile.am
├── Makefile.in
├── proto
├── README
├── src
├── testwrapper.sh └── version-gen.sh
6 directories, 11 files
Next, install Collectd in the build directory as shown in the example below; if the configure script requires missing dependencies, follow Collectd’s First steps wiki to install them before continuing with setup.
# change to extracted collectd directory
> cd collectd-5.8.0
# configure the target build directory
# give the fully qualified path as prefix
# $COLLECTD_HOME points to collectd-5.8.0 directory
> ./configure --prefix=$COLLECTD_HOME/build
# install collectd
> sudo make all install
# verify the build directories
> tree -L 1 build
build
├── bin
├── etc
├── include
├── lib
├── man
├── sbin
├── share
└── var
8 directories, 0 files
# own the entire collectd directory
# replace  with your username
> sudo chown -R : .
After the Collectd installation is complete, the next step is to update the build/etc/collectd.conf file and add the necessary settings and plugins. The following is a sample collectd.conf file that enables the cpu, df, interface, network, memory, syslog, load, and swap plug-ins. For more information on available plug-ins and their settings, see the Collectd Table of Plugins.
# Base Configuration
# replace all paths below with fully qualified
# path to the extracted collectd-5.8.0 directory
Hostname "helpinghands.com"
BaseDir "/collectd-5.8.0/build/var/lib/collectd"
PIDFile "/collectd-5.8.0/build/var/run/collectd.pid"
PluginDir "/collectd-5.8.0/build/lib/collectd"
TypesDB "/collectd-5.8.0/build/share/collectd/types.db"
CollectInternalStats true
# Syslog
Load
<Plugin syslog>
        LogLevel info
</Plugin>
# Other plug-ins
LoadPlugin cpu
LoadPlugin df
LoadPlugin disk
LoadPlugin interface
LoadPlugin load
LoadPlugin memory
LoadPlugin network
LoadPlugin swap
# Plug-in Config
<Plugin cpu>
  ReportByCpu true
  ReportByState true
  ValuesPercentage false
</Plugin>

# replace device and mount point
# with the device to be monitored
# as shown by df command
<Plugin df>
        Device "/dev/sda9"
        MountPoint "/home"
        FSType "ext4"
        IgnoreSelected false
        ReportByDevice false
        ReportInodes false
        ValuesAbsolute true
        ValuesPercentage false
</Plugin>
<Plugin disk>
        Disk "/^[hs]d[a-f][0-9]?$/"
        IgnoreSelected false
        UseBSDName false
        UdevNameAttr "DEVNAME"
</Plugin>
# report all interface except lo and sit0
<Plugin interface>
           Interface "lo"
           Interface "sit0"
           IgnoreSelected true
           ReportInactive true
           UniqueName false
</Plugin>
<Plugin load>
           ReportRelative true
</Plugin>
<Plugin memory>
           ValuesAbsolute true
           ValuesPercentage false
</Plugin>
# sends metrics to this port i.e.
# configured in logstash to receive
# the log events to be published
<Plugin network>
           Server "127.0.0.1" "25826"
           <Server "127.0.0.1" "25826">
</Plugin>
<Plugin swap>
           ReportByDevice false
           ReportBytes true
           ValuesAbsolute true
           ValuesPercentage false
</Plugin>
Once the configuration file is in place, start the Collectd daemon as shown here.
# start collectd daemon with sudo
# some plug-ins require sudo access % sudo build/sbin/collectd
# make sure it is running
> ps -ef | grep collectd

# verify syslog to make sure that collectd is up
> tail -f /var/log/syslog
Next, create a configuration file for the Logstash pipeline. Create the file $LOGSTASH_HOME/config/helpinghands.conf and use the Collectd Codec plugin to receive data from Collectd and its output plugin to send data to Elasticsearch.
input {
  udp {
    port => 25826
    buffer_size => 1452
    codec => collectd {
      id => "helpinghands.com-collectd"
      typesdb => [ "/collectd-5.8.0/build/share/collectd/types.db" ]
    }
  }
}
 output {
   elasticsearch {
     id => "helpinghands.com-collectd-es"
     hosts => [ "127.0.0.1:9200" ]
     index => "helpinghands.collectd.instance-%{+YYYY.MM}"
   }
 }
Next, run the Logstash pipeline to receive data from the Collectd process via UDP and send it to Elasticsearch. Verify before running Logstash that the 25826 port specified in the UDP configuration above matches the network plugin port in the Collectd configuration, and that both Elasticsearch and Collectd are running.
# change to $LOGSTASH_HOME directory and run logstash
> bin/logstash -f config/helpinghands.conf
Once Logstash is up and running, observing the Elasticsearch logs, we see that based on the helpinghands.collectd.instance-%{+YYYYY.MM} pattern configured in Logstash’s Elasticsearch output plugin, a new You can see that an index has been created. Note that the index name will vary depending on the current month and year. It is recommended that indexes storing time-series data sets maintain a time-based index pattern. This not only helps with query performance, but also with backup and cleanup based on the organization’s data retention policy. The following will be the log messages that can be seen in the Elasticsearch log file when Logstash has successfully created the necessary indexes for the data retrieved from Collectd.
[2018-01-16T02:04:12,054][INFO ][o.e.c.m.MetaDataCreateIndexService]
[W6r6s1z] [helpinghands.collectd.instance-2018.01] creating index, cause
[auto(bulk api)], templates [], shards [5]/[1], mappings []
[2018-01-16T02:04:15,259][INFO ][o.e.c.m.MetaDataMappingService] [W6r6s1z]
[helpinghands.collectd.instance-2018.01/9x0mla-mS0akJLuuUJELZw] create_mapping [doc]
[2018-01-16T02:04:15,279][INFO ][o.e.c.m.MetaDataMappingService] [W6r6s1z]
[helpinghands.collectd.instance-2018.01/9x0mla-mS0akJLuuUJELZw]
update_mapping [doc]
[2018-01-16T02:04:15,577][INFO ][o.e.c.m.MetaDataMappingService] [W6r6s1z]
[helpinghands.collectd.instance-2018.01/9x0mla-mS0akJLuuUJELZw]
update_mapping [doc]
[2018-01-16T02:04:15,712][INFO ][o.e.c.m.MetaDataMappingService] [W6r6s1z]
[helpinghands.collectd.instance-2018.01/9x0mla-mS0akJLuuUJELZw]
update_mapping [doc]
[2018-01-16T02:04:15,922][INFO ][o.e.c.m.MetaDataMappingService] [W6r6s1z]
[helpinghands.collectd.instance-2018.01/9x0mla-mS0akJLuuUJELZw]
update_mapping [doc]
Run the pipeline and save the machine metrics obtained by the Collectd-Logstash-Elasticsearch pipeline. Now open the Kibana interface in your browser using the URL http://localhost:5601 and click on the Set up index patterns button in the upper right corner. The newly created index helphands.collectd.instance-2018.01 will be automatically listed as shown in the screenshot below.

Add the index pattern helphands.collectd.instance-*, as shown in the previous screenshot, to include all indexes created for metrics retrieved by Collectd. Click the Next step button on the right and select the Time filter field name to @timestamp, as shown in the next screenshot.

Next, click on the Create index pattern button as shown in the previous screenshot, which displays a list of fields that Kibana was able to retrieve from the Elasticsearch index mapping. Now, click on Discover in the menu on the left to see a real-time dashboard of all the messages that have been captured, as shown in the next screenshot.

The left panel of the Discover screen lists all the fields that are being captured. For example, by clicking on the Hosts and Plugins fields, you can see the monitored hosts and all plugins for which data was captured by Collectd and sent to Elasticsearch via the Logstash pipeline, as shown in the screenshot below The data is captured by Collectd and sent to Elasticsearch via the Logstash pipeline.

The Kibana dashboard allows you to build dashboards with a variety of visualization options. For example, to view CPU usage since Collectd started monitoring, follow these steps
- Click on “Visualize” in the left panel of the Kibana application.
- Click the Create a visualization button.
- Click Line and select the line chart
- Select the index helpinghands.collectd.instance-* pattern from the left section.
- Click on the “Add a filter +” option under the search bar at the top.
- Select the filter as plugin.keyword is cpu and save it.
- Click on the Y axis and change Aggregation to Average.
- Select the field as Value
- Next, click on the X-axis Buckets.
- Set the Aggregation to “Date Histogram”.
- The @timestamp field is selected by default.
- Set the interval to Auto.
- Click on the Play icon at the top of the Metrics panel to apply the change.
- A chart will appear on the right side, as shown in the next screenshot.
- Click on the arrow icon at the bottom of the chart area to display the tableKibana

After following these steps, you can see the CPU utilization over time for the past 15 minutes (default), as shown in the screenshot above. The visualizations created can be saved and later added to a dashboard to build a full-fledged dashboard that monitors all metrics captured in real time.
Log Collection and Monitoring Guidelines
Microservices need to generate both application logs and audit logs that can be retrieved by the ELK Stack. Application logs can be generated by the service using Clojure’s tools.logging library, which records messages in standard log4j-style syntax. Logstash works well with most of the common logging formats, but it is recommended to use structured logging is recommended.
Structured logs are easier to parse and load in a centralized repository using tools such as Logstash. libraries such as timbre support structured logging and can also expose logs directly to remote services instead of logging to a file. This will also make it possible to publish logs directly to remote services instead of logging to a file. In addition to structured logging, the inclusion of predefined standard tags in log messages is also required, as shown in the following table.

Tags are particularly useful for filtering log messages generated by services of interest, and can also help to further drill down into logs via specific state-level tags, such as log messages logged at startup, shutdown, or as a result of an exception.
In addition to tags, it is also recommended that UTC be used at all times while generating log messages. Since all these log messages are aggregated in a centralized repository, different time zones make analysis difficult due to out-of-sync time zones on host machines that may be operating in different time zones.
Log messages are very useful for debugging problems and providing information about the state of the application, but they significantly affect the performance of the application. Therefore, logging should be as asynchronous and careful as possible. It is also recommended that log events be issued asynchronously to a channel such as Apache Kafka, rather than logging to a file that requires disk I/O. Logstash has an input plugin for Kafka that reads events from a Kafka topic and then logs them to a It will be possible to read events from Kafka topics and publish them to a targeted output plugin such as Elasticsearch.
Riemann is an alternative to the ELK stack. Used to monitor distributed systems, such as those based on microservice-based architectures, Riemann is extremely fast and can generate alerts in near real-time without overwhelming the recipient using a roll-up and throttle structure.
In the next article, we will discuss Docker and Kubernetes for deployment and operation of microservices.

コメント